Reprinted from Industrial Heating, August, 2003
Expert System Pyrometer Gives Accurate Temperatures Under Tough Conditions
Ralph A. Felice, FAR Associates, Solon, Ohio
The Spectropyrometer, an expert system multiwavelength pyrometer developed in the mid 1990s by FAR Associates, has been used in a wide variety of applications providing a wealth of information not previously available.
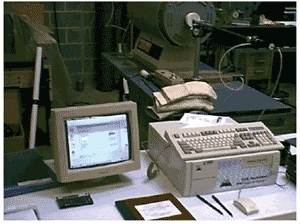
Measuring emissivity using an expert-system multiwavelength Spectropyrometer
The Spectropyrometer was developed to address the flaws of traditional radiation pyrometry that lead to inaccurate temperature measurement. Traditional pyrometers require the operator to provide emissivity information that is difficult to obtain. Emissivity values for many material compositions cannot be found in reference publications, and if the exact composition is found, the reported range of emissivities is often too broad to dispel the uncertainty. Ratio pyrometry was an earlier attempt to address these problems. The intent was to cancel out the contribution of emissivity by dividing the intensities at two wavelengths, but for ratio pyrometry to return accurate temperatures, the emissivity must be the same at both wavelengths, and this is not always true. Therefore, some devices provide a “non-grayness” adjustment, again requiring the operator to know the emissivity, but now at two discrete wavelengths. Compounding the problem, ratio pyrometers typically use fairly broad wavelength ranges (despite referring to the two wavelengths in the singular), and anything that affects the intensity within these ranges affects the temperature.
By comparison, the multiwavelength Spectropyrometer requires no operator input. By virtue of the huge amount of data it collects (intensities at hundreds of narrow spectral bandwidths instead of two broad ones), the instrument can perform a large number of tests to determine the behavior of the target and environment for itself. Consequently, it is an active rather than a passive device; it detects and corrects for changes that affect traditional pyrometers. In addition, the operator instantly knows the quality of each measurement from the tolerance that is reported simultaneously with the temperature.
When the instrument was introduced in 1995 [1], the bulk of the reported data resulted from short visits to various sites using only a small number of custom instruments. Since then, commercially available instruments have been used in many applications, and the abundance of new information has resolved many previously intractable problems. The instrument meets the challenge of materials whose emissivity changes with wavelength, provides temperature measurement values to an accuracy of +/-2 C (+/-4 F), and reports both the tolerance (the on-line accuracy for each measurement) and the signal strength (the emissivity at a chosen wavelength as modified by the environment).
The Problems
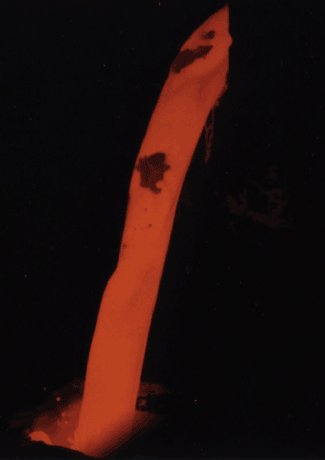
A turbulent pour stream with solid inclusions and thermal gradients
The problems lie in the target and the environment: a successful pyrometric measurement must allow for target emissivity and environmental interference. Emissivity, the ratio of the emitted radiation of a real radiator to that of an ideal radiator, depends on chemical composition, surface finish, the wavelength(s) at which the measurement is made and the temperature of the target. A material’s surface finish and composition often are affected during processing, causing changes in the emissivity. Environmental interference results from absorption or emission of thermal radiation by the material between the instrument and the target, and often fluctuates during processing as material from product or furnace offgas is added to the atmosphere. This interference effectively changes the thermal spectrum and confuses traditional pyrometers.
The Solution
The Spectropyrometer is an expert-system multiwavelength pyrometer that not only measures the temperature, but also reports the accuracy and the emissivity for each measurement. It can be thought of as an autoexposure camera that records the color content of the scene, the spectrum, as hundreds of coordinated pairs of wavelength and intensity. Advanced algorithms analyze the spectral data and determine the true temperature. The accuracy of the result is gauged by how well these data agree on a single value of temperature; the tolerance shows the range of the results. A thorough discussion of the algorithms is presented in U.S. Patents 5772323 and 6379038B1. The instrument, based on a spectrophotometer, consists of a lens or other optical pickup and a console that contains the detector and offers all the functionality of a desktop computer, including networking. A fiberoptic cable interconnects the lens and console.
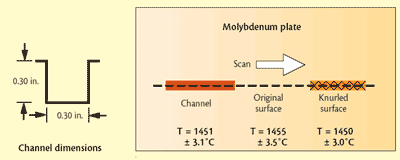
Fig 1 Mo plate with surface modifications and scanned temperatures below each surface condition
Lessons Learned
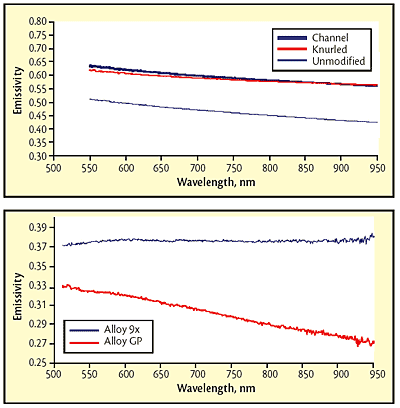
Fig 2 Emissivity for three molybdenum-plate surface conditions; Fig 3 Variation in spectral emissivity with small changes in composition. Values are reduced by the approximately 4% reflection at each of the glass surfaces of the sight port.
The findings of the Spectropyrometer in practical, real-world measurements parallel exactly the problems described above. Data show the Spectropyrometer detects and corrects for:
- Emissivity that changes with wavelength, temperature, composition and surface treatment
- Emissivity that changes in a turbulent liquid
- Interference with the thermal spectrum from gaseous absorptions and emissions.
Metals in particular often exhibit emissivity changing with wavelength as illustrated in the following examples.
Emissivity changing with wavelength
Solid molybdenum: In a Czochralski crystal growth application, a molybdenum (Mo) vessel is heated by radiation. The emissivity of the Mo governs the heating efficiency and, thus, furnace productivity. Therefore, to evaluate the effects of surface finish on emissivity, the Mo was modified by lightly knurling one area of the surface and by machining a shallow square-bottomed channel (depth/width ratio of 6:5) in another area. The rest of the surface was left unmodified and appeared shiny. Details are shown in Fig. 1. The surface was scanned using optics focused to a spot having a diameter of one-half the width of both the channel and the knurled area.
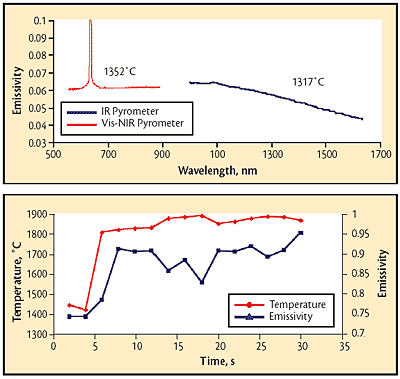
Fig 4 Relative emissivity of a silicon target measured sequentially using two Spectropyrometers (emissivity modified by fill factor of field of view); Fig 5 Temperature and emissivity profiles of pour stream during pouring. Pouring begins at five seconds; temperatures before that time reflect hardened material cooling in the pour spout.
Test results show that both modifications enhance emissivity, but there was still a spectral dependence. Despite the different wavelength dependence for the emissivity in each of the three areas, the Spectropyrometer returned the same temperature for each: 1451 +/-3.1 C in the channel, 1455 +/-3.5 C on the original surface and 1450 +/-3.0 C on the knurled surface. While these temperatures are expected to be the same because of the excellent thermal conductivity of Mo, traditional pyrometers would give different values for each area. The Spectropyrometer calculated spectral emissivity for each of the three areas. Figure 2 shows that emissivity was enhanced 20 to 30% by the treatments, and spectral dependence was reduced by a factor of 2.
Tantalum metal powder: In a powder-metallurgy application involving vacuum sintering of pressed tantalum oxide, it had been assumed that all tantalum alloys being processed had the same emissivity because the compositions varied by only a few atomic percent of alloying elements. However, the Spectropyrometer showed that the emissivity of some compositions had a significant spectral dependence while that of other compositions had none. Figure 3 shows the results for two different alloys.
The values of the emissivities at 650 nm varied by 20%, which could explain occasional process upsets (workpieces melted or slumped due to overheating). The combination of change in absolute value and change in wavelength dependence of emissivity would have confused any traditional pyrometer.
Silicon wafers: Silicon metal presents a particular problem to pyrometry. Silicon used in integrated circuits is doped with different materials in various concentrations. Its emissivity is extremely temperature dependent [2]. In the 1,100 nm bandgap region, drastic changes in emissivity have been reported by some researchers [3] but not observed by others [4]. Emissivity also has been reported to be affected by the manner of heating [5]. An active pyrometer (one that responds to varying target emissivity) is much more able to make an accurate temperature measurement.
The temperature of a silicon wafer undergoing radiative heating was measured using visible/near-infrared (Vis/NIR) and infrared (IR) Spectropyrometers (high and low temperature versions whose ranges both include the melting point of silicon). The instruments shared a common optical path, so measurements were made sequentially. Process conditions were changed between the two measurements, resulting in different temperatures. Each instrument returned reasonable temperatures with good internal correlation; i.e., tolerances were small. Challenges to both instruments included a strong environmental emission line present in the visible spectrum and emissivity wavelength dependence in the IR range. Results are shown in Fig. 4. The change in emissivity near the 1,100 nm bandgap is evident.
The emissivity values shown are relative values because the sensing area of the pyrometers was not filled. Calculation of the relative geometric areas of the sensing spot and the heated area gives a ratio of 10, which means that the absolute emissivity is a factor of 10 greater than the graphed values. The adjusted emissivity values (around 0.6) agree well with reported values [2].
Emissivity changing with turbulence
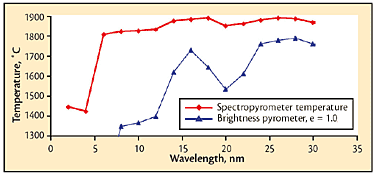
Fig 6 Pour-stream temperatures from multiwavelength pyrometer and corresponding calculated temperatures from a portable brightness pyrometer in peak-picker mode with emissivity = 1.0.
In molten material pour streams, portable pyrometers with the peak value function engaged are most often used for noncontact temperature measurement. This function, also known as the “peak-picker,” retains the highest value seen by the pyrometer over some period of time chosen by the manufacturer. Almost all portable devices are brightness pyrometers, which respond only to the amount of radiation. This means anything that affects the amount of radiation affects the temperature measurement value.
Pour streams are not uniform in temperature or in composition (refer to lead photo). The turbulent surfaces of these liquids constantly form different structures. Figure 5 shows the results achieved using a Spectropyrometer on a pour stream. The colder values at the beginning of the temperature trace show the spout temperature with frozen material from a previous pour slowly cooling. The emissivity of the frozen material is constant at this point. The pour starts about five seconds into the trace. The temperature immediately rises to over 1800 C (3270 F) and stays near that point for the entire data collection period. Some structure is apparent, but the temperature moves smoothly for the most part.
The emissivity results are significantly different, with the magnitude varying about 25% over the average value. In the liquid phase, the lowest value of emissivity is measured at the highest temperature recorded. The laboratory emissivity for the material in question was about 0.5. The actual results for this particular pour were between 0.74 and 0.95. The explanation is that the liquid is making and breaking blackbody cavities that enhance the value of the emissivity. Even the value of 0.74 for solid material reflects a frozen-in, roughened surface, which affects the emissivity value. (Other data collections produced values of 0.5 for the solid material.)
The values of temperature that would have been obtained using the standard technique (a portable device with emissivity set to 1.0) were calculated from the retained thermal spectra and are shown in Fig. 6, with the Spectropyrometer temperature results included for comparison. This clearly shows that an instrument that assumes constant emissivity and uses a peak-picker would give very inaccurate results.
Atmospheric interference
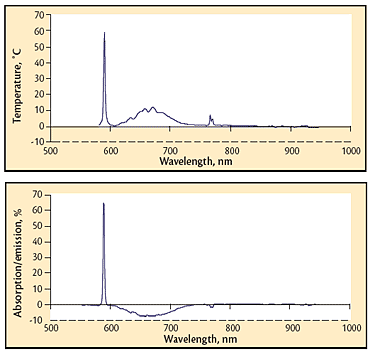
Fig 7 Absorption spectrum of a high-pressure process; sodium and potassium lines are present (589 and 768 nm) in addition to a broadened absorption in the 620-740 nm range. The graph is the difference between the thermal spectrum and the ideal spectrum for the temperature measured.; Fig 8 Similar spectrum to that shown in Fig. 7, except the species in the 620-740 nm range and potassium are radiating instead of absorbing. The graphic indication of emission is a negative value of the trace in the radiating region.
Absorption of a portion of the thermal spectrum is common in processes carried out at atmospheric and higher pressures. This behavior is especially prevalent in the shorter wavelengths favored by pyrometry (around 650 nm). An absorption spectrum from a hot isostatic pressing operation (Fig. 7) was generated by subtracting the thermal spectrum collected and saved by the Spectropyrometer from the theoretical thermal spectrum calculated from the temperature it returned.
The same process generated the data in Fig. 8. Both absorptions and emissions are visible. The emission/absorption dichotomy observed from 620 to 770 nm was not initially understood. Both behaviors (absorption and absorption/emission) often occurred within the same run. The data routinely collected by the Spectropyrometer with no additional instrumentation or even very extensive analysis provided the explanation for this puzzling phenomenon. During one run, a modest process gas leak developed; the system was able to maintain pressure, but gas was added more frequently. The emission portion of the spectrum “flipped” to absorption when the leak began. The thermal spectrum was inserted into a spreadsheet template and the absorption/emission curve was automatically calculated and plotted, revealing the correlation between the gas leak and the absorption/emission flip. Exposed direct resistance-heating elements heated the vessel. Process gas became sufficiently conductive from workpiece offgassing to provide a parasitic electrical path. Electric current flowing through the process gas excited the species enough to glow, causing the emissions. When the leak diluted the process gas, lowering its conductivity, the parasitic path was broken and the emission flipped back to absorption. The emission/absorption dichotomy correlated with product quality, but it would not have been discovered, let alone resolved, without the Spectropyrometer.
Summary
The Spectropyrometer collects and analyzes the intensity of the thermal spectrum at hundreds of wavelengths. The large amount of data allows the instrument to determine and correct for emissivity, even if it is changing constantly, and to eliminate any gaseous interference caused by the process atmosphere. In addition to reporting temperature, it reports the accuracy of each measurement and the efficiency of the optical path and target. Results are stored in a time-stamped log for easy retrieval. It also stores the raw data (the thermal spectra) for further analysis. This type of analysis gives insight into previously unsuspected process behavior.
The ability of the instrument to accommodate changing emissivity and environmental interference without operator input directly addresses the significant flaws of traditional radiation pyrometers.
References
- R.A. Felice, Ind. Heating, p 74-79, Sept. 1995
- T. Sato, Jap. J. Appl. Phys., 6, 339-346, March 1967
- Op. cit.
- H. Watanabe, M. Susa, H. Fukuyama and K. Nagata, High Temperatures – High Pressures, 31, 587-593, 1999
- G. Chen, T. Borca-Tasciuc and R.B. Fair, J. Appl. Phys., 82 (2), 830-835, July 1997
