Plasmas and Flames
Pyrometry can be applied to high-temperature low-pressure gases with solids or liquids entrained, or gases at a high enough pressure to radiate in a continuum[1]. SpectroPyrometry has been applied to various plasmas and flames with success.
Rocket Plume
Theoreticians wondered at the actual temperature of the rocket plume of a particular rocket motor. Not only was the emissivity of the plume unknown, but the measurement would also be complicated by the fact that these rockets fired for less than a second in testing. For a pyrometer to work on this challenging application, it must determine emissivity on its own and have very fast optics and electronics. It would have to store the results, or transmit them in real-time to an external storage device (or both). An FMPI SpectroPyrometer was tried successfully in this application. The FMPI can make a measurement in as little as a few microseconds (millionths of a second).
SpectroPyrometers report both tolerance and signal strength[2] with temperature. The graph below shows the temperature and signal strength for a rocket burn of around 0.8 seconds duration.
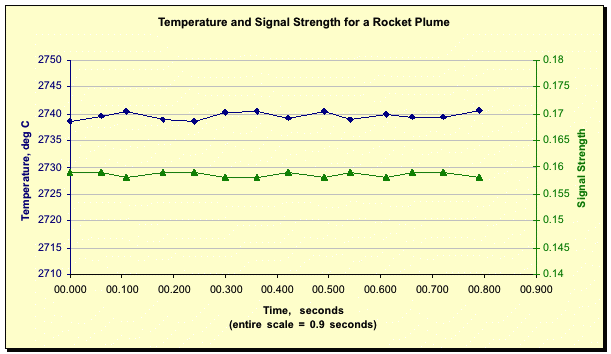
Temperature and signal strength of a rocket plume for a fractional-second burn. Here the signal strength is equal to the emissivity.
The constancy of temperature and signal strength are notable. Over three successive burns of the same engine, the temperature averaged 2740.7°C with a standard deviation of 1.8°C. The SpectroPyrometer’s tolerance for the three burns averaged 15.2°C for an on-line accuracy of 0.5%. It should be noted that if conventional pyrometry were to be applied to rocket plumes, the result would depend on estimates of the emissivity of the plume. For these measurements, the SpectroPyrometer determined the values of emissivity in real time. For this measurement setup, the Signal Strength is exactly equal to the emissivity. Interestingly, the measured temperatures agreed with the theoretical predictions.
Semiconductor Plasma Deposition
The deposition of materials on a substrate is often driven by plasmas, where the plasma can be generated by electric arc, laser, or some other means. The temperature of the depositing material is of interest both as a function of power generating the plasma and distance from the generator. An FMPI SpectroPyrometer was used to measure both of these dependencies for a plasma deposition process. It was clear that the depositing species was the source of the temperature measurement, as no thermal spectra was observed by the FMPI when the material was not in the plasma stream. As is seen in the chart below, the temperature was observed to be relatively constant with power, but changing with distance from the injection point of the depositing material.
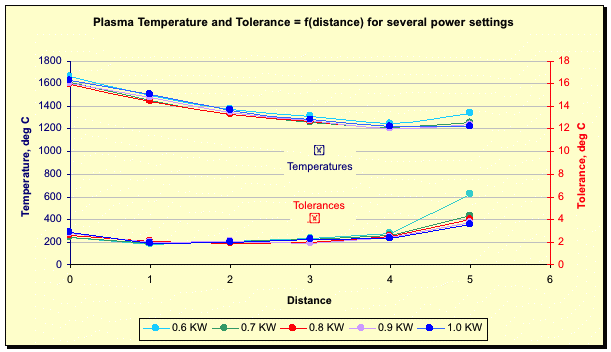
Plasma temperatures and the on-line accuracy of those temperatures (Tolerance) for a deposition process, as measured by a FAR FMPI SpectroPyrometer.
The graph below presents the same temperature data with Signal Strength (emissivity) on the right side y-axis.
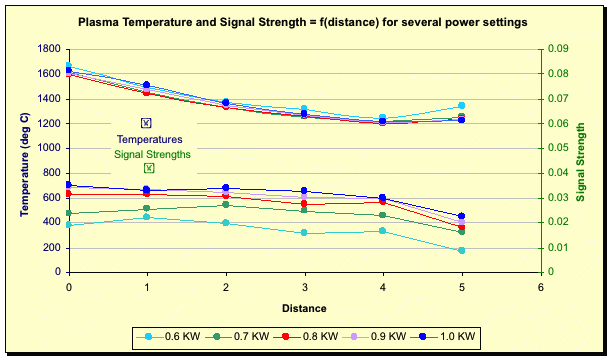
Plasma temperatures and on-line Signal Strength (emissivity) for a deposition process, as measured by a FAR FMPI SpectroPyrometer. Signal Strength values are reported at 1500 nm.
The data indicate that the Signal Strength increases with power. The Signal Strength here is the product of the emissivity of the radiating material in the plasma stream and its density in the stream. Thus, for a given location (and temperature), it is seen that there is more material in the plasma stream for a higher power setting, which is the expected result. Further, it appears that the Signal Strength is relatively invariant with distance until the very farthest distance from the generator (“5”). This can be interpreted to give information about the emissivity of the material with temperature and about the spreading of the plasma beam with distance. (That is, the fixed optics of the FMPI SpectroPyrometer always subtend the same solid angle. Therefore, a decrease of emissivity implies a decrease of density of material in the field of view; i.e. the beam is spreading.)
The Spectral Signal Strength (Spectral Emissivity) was examined for the data generating the graphs above (the SpectroPyrometer is capable of presenting spectral signal strength/emissivity graphs on line and storing them to non-volatile memory). One such graph is reproduced below.
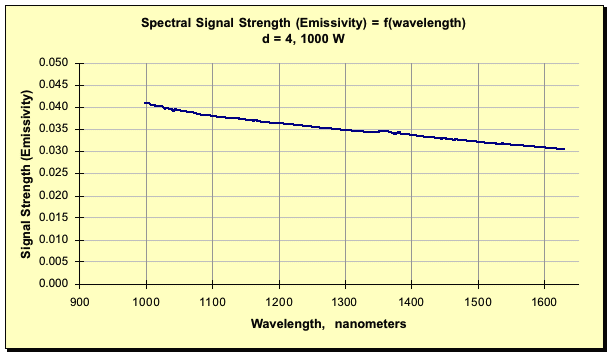
Spectral Emissivity (Signal Strength) for a semiconductor material entrained in a plasma. Emissivity changes with wavelength as is usual in metals.
Note that the Signal Strength (Emissivity) is not constant with wavelength, i.e., not “gray”. Conventional pyrometry would be unable to measure the temperature of this material for two reasons: the absolute value of emissivity changes with power setting, and the relative value of emissivity changes with wavelength. The last feature, the non-grayness, was unknown prior to the SpectroPyrometer’s measurement. Further, the non-grayness is not a static variable of the material, but a dynamic variable of the application; it, too, can change during the deposition. The non-grayness, routinely found in metals, has been recorded by the SpectroPyrometer to vary around 10% for this process. The obvious conclusion is that only a pyrometer such as the SpectroPyrometer which is independent of emissivity’s variations can measure temperature accurately for these materials.