Molten targets
Liquids are a challenging target for traditional pyrometers; in contrast, the SpectroPyrometer has performed well on liquids. In addition to the difficulties cataloged for solid targets, liquids also undergo emissivity changes due to the changing shape of the surface. A turbulent fluid continually forms droplets and cavities that enhance the material’s emissivity to some degree. A good example is this casting stream of a molten material.
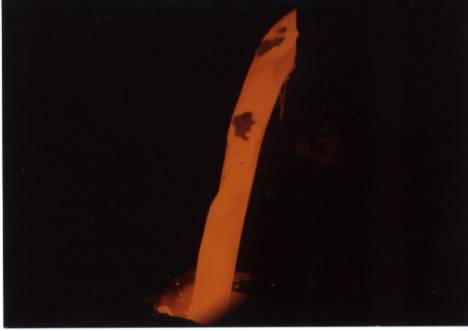
Pour stream of a refractory ceramic material.
The picture shows surface structure on a large scale. The inverted-y shape between the two solid inclusions at the top illustrates the point perfectly. It may be a local cold spot due to stratification of the melt, or it may be a locale of lower emissivity due to the shape of the stream. Measurement on liquid streams is often done using portable pyrometers with through-the-lens aiming and a peak holding function (commonly known as a peak-picker, this mode of operation records the highest temperature seen in one measurement). Unfortunately, this technique does not guarantee measurement of the stream’s high temperature. The graph below illustrates this. It shows temperature and emissivity values of a pour stream measured by the SpectroPyrometer. Liquid flow starts at 5 seconds; temperatures before this are of frozen material from a previous pour. It is seen that emissivity decreases at the highest temperatures recorded. Portable pyrometers, which are usually single-color instruments, would misinterpret these emissivity fluctuations as changes of temperature. They would show the temperature decreasing instead of increasing.
Temperature and emissivity of a ceramic pour stream measured by a SpectroPyrometer.
The variability of the emissivity in the solid state points out its dependence on surface shape. At the start of the data above, the emissivity of the frozen material is 0.74. During a subsequent pour, the data points graphed below were collected. The first 24 seconds of these show the slow cooling of material left in the spout after a pour. As the material solidifies the emissivity drops until it levels off at about 0.55. There was no difference in the composition of the material between the two pours. The differences in solid-state emissivity are entirely due to the shape the material assumes as it freezes.
Continuing in the graph below, liquid starts to flow at the 25-second mark; the temperature increases immediately to 1800°C and the emissivity decreases to about 0.5. This is the material’s laboratory value of emissivity and the lowest value measured throughout (more than 20 distinct pours). Finally, at the 28-second mark, turbulence increases the emissivity while the temperature stays relatively constant.
Temperature and emissivity of slowly cooling material left in a pour spout followed by a fresh stream of molten liquid (25 seconds).
Emissivity has also been seen to increase as a melt freezes. The data below show a metal melt slowly freezing after power was removed. The emissivity increases from 0.22 to 0.60 as the metal solidifies. The temperature of the onset and conclusion of freezing can be easily determined by looking at the graph. That the material was an alloy that freezes by going through a slushy, intermediate phase can also be seen. If it had behaved like pure water, temperature would have remained constant during the phase change.
Temperature and emissivity tracked by a SpectroPyrometer as the melt cooled and eventually froze. The metal was a nonferrous alloy.
If the melted material were one whose emissivity exhibits a dependence on wavelength, the measurement of temperature would be impossible for a passive instrument (one that did not correct for changing emissivity). The FAR expert system SpectroPyrometer would still be able to determine the temperature, and to resolve the emissivity’s spectral dependence as in the example below.
FAR SpectroPyrometer results on measurements of two tantalum alloys. Alloys are more than 95% tantalum and differ in compositions by a few atomic percent of alloying materials.
This method involves two sets of optics in the instrument supposedly looking at the same target. The user sees a reticle that is meant to define the target dimensions for the measurement; the instrument’s detector is intended to see the same area. In practice, it is very difficult for any design to ensure the complete alignment of the two spots. Tests in our laboratory during the calibration of instruments that aim in this manner have shown that, in the extreme, the two spots do not even touch each other. A large percentage shows some mismatch between the two optical paths. The best way to ensure the target being measured is the intended target is to use only one optical path. FAR does this.