High Pressure Applications — Hot Isostatic Pressing (HIP)
Pyrometry in high pressure applications, such as hot isostatic pressing (HIP) is similar to pyrometry in any closed vessel with many of the difficulties magnified. All pyrometry requires data acquisition and data analysis. At high pressures, the acquisition of data requires special optical hardware. Collection of the thermal radiation can be by external or internal optics. External optics require a sight port capable of withstanding the pressure differential between the furnace interior and ambient (or between the furnace interior and an intermediate pressure for multi-stage pressure ports). Best technique is to enclose the sight port in a fabrication capable of withstanding the highest pressure achieved and backing the sight port with a safety valve. This protects the process in the event of catastrophic failure of the sight glass. An example is shown below.
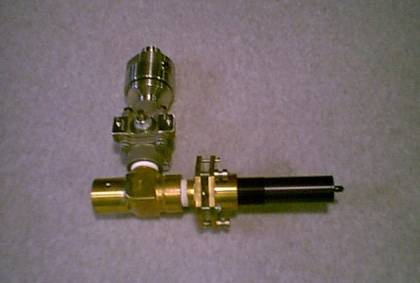
External bottom-mounted, adjustable optics. Assembly incorporates folding mirror due to limited clearance beneath pressure vessel. High-temperature high-pressure valve backs the sight port.
Internal optics (example below) can be used in those vessels which have relatively cool (less than 500°C) sites appropriately located inside the pressure bulkhead. The internal optics are designed to automatically acquire the target on insertion.
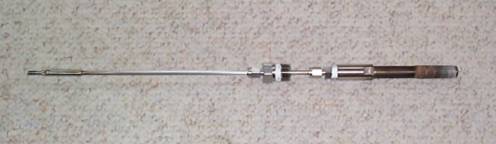
Internal optics require no adjustment. The assembly shown has seen extended use.
Once the signal is acquired and before temperature is calculated, it must be examined for absorptions or emissions caused by the pressure-broadened line spectra of product offgas or combustion products. The offending lines or bands must not be included in the temperature calculation or the resulting temperature values would be in error. The graph below is the spectrum generated from a typical high pressure data collection.
Radiation spectrum as collected.
The next graph includes the data spectrum, and adds the spectrum calculated from Planck’s law for the temperature determined by FAR’s SpectroPyrometer, 2027°C.
Radiation and calculated spectra. Note the departures from ideal in the data spectrum.
The following spectrum is the percentage difference between the two spectra graphed above. This is the absorption spectrum.
Absorption spectrum at 2027°C. Values at peak wavelengths have been noted; the large absorption at 590 nm is attributed to sodium; that at 766 nm to potassium.
The identification of absorbing species is a bonus of this technique. This capability can be used as a measure of product quality. It should also be noted the absorption spectra are quite changeable due to the varying vapor pressure of each species. Huge absorptions have been observed to appear and vanish with process conditions. This suggests an active instrument that detects and eliminates the absorptions would perform better than an instrument with fixed wavelength response.
It is clear that pyrometry at high pressures offers significant challenges to traditional pyrometers. The results from the SpectroPyrometer suggest that, despite these challenges, high pressure pyrometry can be accomplished in a straightforward way with the appropriate tools.