Environmental interference — absorption/emission compensation
High temperature operations carried out at atmospheric or higher pressures have the potential for generating offgas that can interfere with thermal radiation. The effects on temperature measurement by radiation pyrometers can be surprisingly large. The source of the offgas can be vaporized product, processing equipment (furnace or furniture), or combustion byproducts. Graphite is a particularly common source of materials that vaporize to become offgas. Some of the offending species that have been identified are sodium, potassium, iron, vanadium, aluminum, and many cyanogens. Because of their temperature-dependent vapor pressures, these materials tend to show up at different stages of processing, adding to the variability of the thermal spectrum. In addition to offgas, steam and other process gases may also absorb thermal radiation.
The graph below shows the disruption of the actual thermal spectrum by gas absorption. The ideal thermal spectrum calculated from the temperature measured by the FAR SpectroPyrometer is provided for contrast.
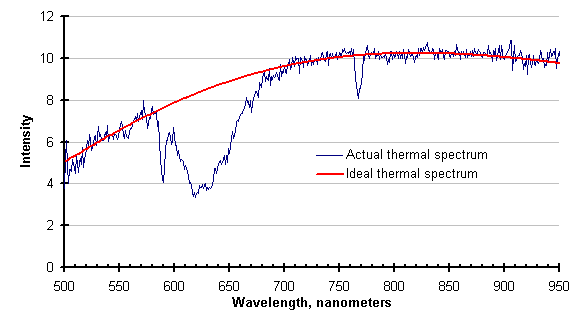
Unfortunately, the region around 650 nanometers is an important one in pyrometry. For historical reasons[1], many modern instruments have been designed to operate in this range. Instruments that do, whether they are single or two-color pyrometers, will be wrong in the conditions described above. In this case, the pyrometer replaced by the FAR SpectroPyrometer was incorrect by about 12%.
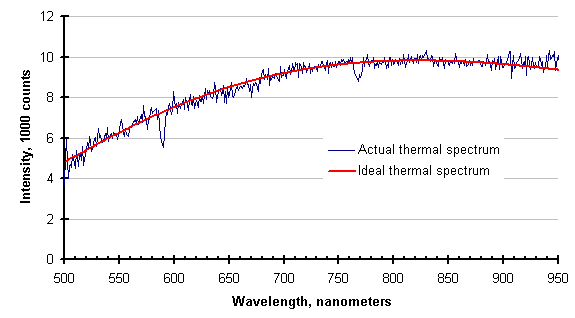
The operators of this process, suspecting something was amiss, were purging the optical path with an inert gas. They had no way of knowing that their purge was inadequate until the data was collected and displayed by the SpectroPyrometer. After the guidance of the SpectroPyrometer, the flow rate of the purge was increased drastically (by a factor of 6) and the following spectrum was collected. The SpectroPyrometer returned essentially the same temperature with and without the adequate purge.
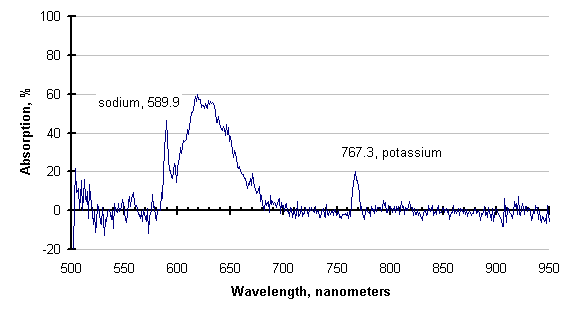
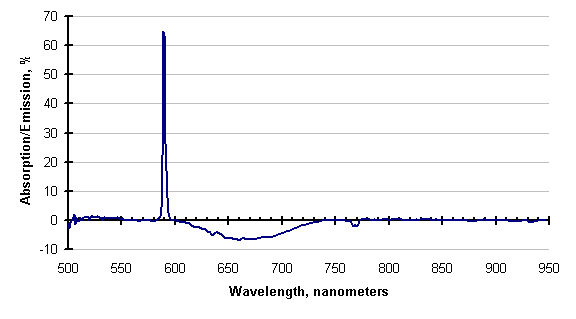
The graph below, generated by subtracting the two traces before the purge increase, is the absorption spectrum of the process atmosphere. It is similar to graphs which would be provided by Atomic Absorption Spectrometry, and could be used to identify species present.
If there is enough energy available, the absorbing species may be excited enough to emit instead of absorb. This has also been observed; an example is shown below.
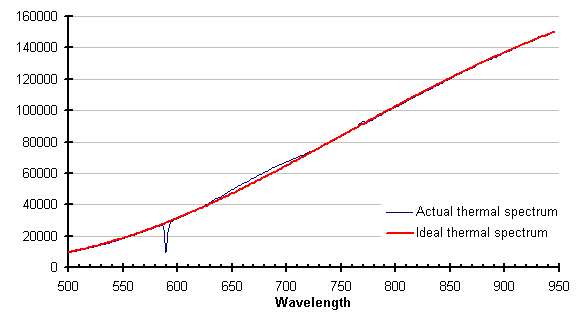
The line attributed to sodium (589 nanometers), is still absorbing, but the cyanogens (about 600 to 730 nm) and the potassium line (768 nm) are emitting. This is clearer in the subtraction of these two traces, shown below. Negative-going values of this trace indicate emission.
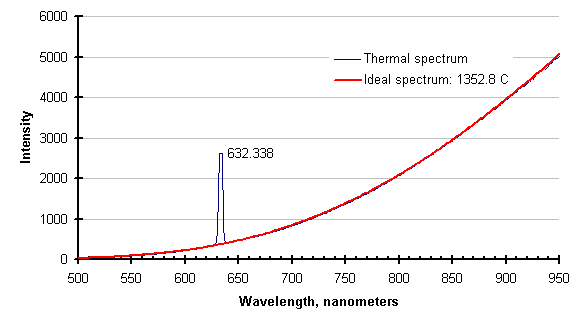
The same feature that eliminates process absorptions/emissions eliminates laser light. The graph below shows the thermal spectrum of a silicon wafer while it was illuminated with a helium-neon laser, and the ideal thermal spectrum for the temperature returned by the SpectroPyrometer.
©2010 FAR Associates.
