Arc Interference
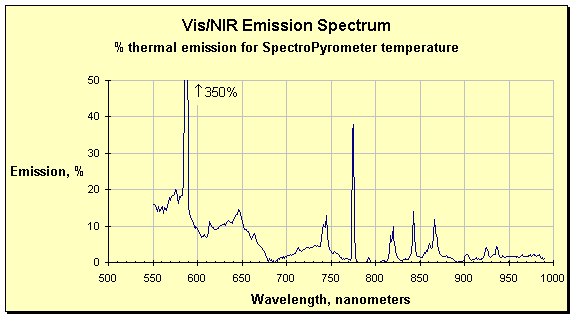
Arc sources are among the worst offenders when it comes to interference with pyrometer temperature measurements. The arc often overpowers the thermal radiation and can confuse all conventional pyrometers. When a conventional pyrometer is used in such an environment, the result is often doubt; the most common symptoms include rapidly fluctuating values of temperature and saturation of the pyrometer (constant indication of highest value). The emission spectrum below illustrates the situation.

Emission spectrum of an arc source reflected from the temperature measurement target of an FMP2 SpectroPyrometer. The graph was calculated by subtracting the theoretical Planck’s law curve of the temperature returned by the SpectroPyrometer from the data it stored, then dividing the result by the theoretical curve.
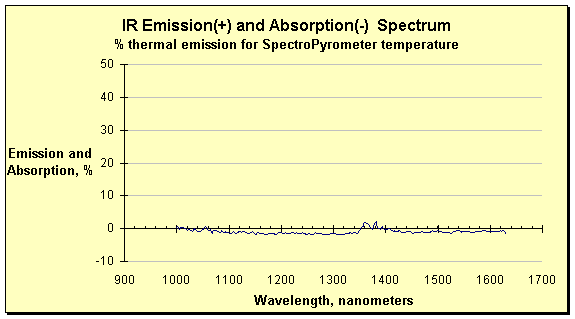
From the graph above, the observation was made that the emissions are greatest at the short wavelengths of the spectrum, decreasing to only a few percent of the thermal emission at the long wavelengths. This suggests that a long wavelength SpectroPyrometer (FMPI, 1000 – 1700 nanometers) might be more appropriate for this particular application. Indeed, this was found to be the case, as the following emission/absorption spectrum shows.

Emission/absorption spectrum measured by an FMPI SpectroPyrometer on the same target and in the presence of the same arc source as above.

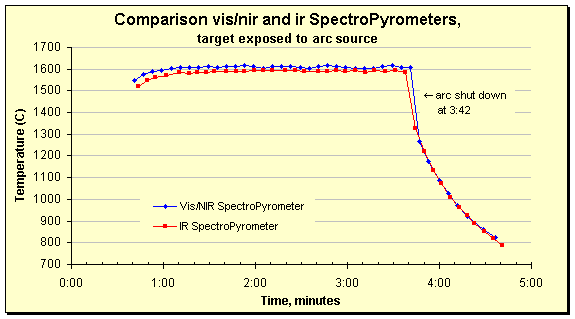
Temperature traces for a sample where the heat source was an electrical arc. The SpectroPyrometers responded from 500 – 1000 nm, and 1000 – 1700 nm. The slight disagreement between the two before arc shutdown is a result of perturbation of 70% of the vis/nir spectrum due to reflected arc light.
The point to be made is that the FMP2 Vis/NIR SpectroPyrometer indicated the problem by showing the spectrum perturbed by the arc’s emissions and returned a value of temperature that was quite reasonable in light of the noise present. If the process requires greater accuracy than can be achieved in the presence of such noise, there are several solutions available. The noise can be removed by optical techniques, or as in this case, a SpectroPyrometer insensitive to the arc may be chosen. No matter what course of action is taken, the user knows exactly what is going on from the on-line tolerance, the on-line graph of the spectrum provided by the SpectroPyrometer, and the post-processing of the data to elicit the emission/absorption curve.
